
Mutual fund investors, especially first time investors, are often bewildered by the array of schemes and plans in the market. The task of choosing the best SIP for investment seems daunting and fraught with risk. But, provided key aspects are diligently assessed, before committing the funds, the investor would end up a satisfied person with financial goals successfully achieved.
About this Article : This article will teach you to find Best SIP for Monthly Investment using Standard Deviation, Alpha and Sharpe Ratio in a Simple way.
Financial Goals
Select your SIP depending upon your investment objective which may be either short term, medium term or long term. Purchase or replacement of a car would be a short term objective, arranging funds for professional education of your child may be a medium term goal while providing for your retirement, or marriages of your children would be long term plan.
Invest in a debt fund for achieving a short term goal, a balanced fund for securing medium term objectives and equity funds for longer term goals. Debt funds are less risky so there is a minimal possibility of the amount invested being jeopardized in the short term. Balanced funds portfolios are a mix of debt and equity with medium risk and reasonable return over a medium term. Equity funds do carry higher risk but that is generally evened out in the long term and growth is faster.
A snapshot of the results of investment in debt fund, balanced fund and equity fund is presented below. The amount invested was Rs.5,000/- on the 7th day of every month for a period of three years from 1st January 2012 to 31st December 2014. The aggregate amount invested worked out to Rs.1,80,000/-

| Debt Fund | Balanced Fund | Equity Fund | |||
| Market Value (Rs.) | Return (%) | Market Value (Rs.) | Return (Rs.) | Market Value (Rs.) | Return (%) |
| 2,07,533 | 9.55 | 2,54,992 | 13.42 | 2,66,299 | 27.45 |
The return from the equity fund is significantly better. That’s because of the directly proportional relationship between risk and reward. Equity funds are for longer term plans, allowing adequate time for recovery in the event that stock prices take a turn for the worse. Debt funds are a safe avenue for short term plans albeit with a lower return, but then, in the near term, the primary objective is security of the investment. Investment in a balanced fund as depicted in the tabulated result strikes a middle path between a debt fund and an equity fund. But the billion dollar question that remains is: How does the investor select the appropriate mutual fund? What parameters should be weighed up? Let’s see the methodology, rationale and tools.
Portfolio Diversification
Depending upon the financial goals of the investor, diversification of the mutual funds portfolio among asset classes becomes inescapable. But, the final distribution of the portfolio would relate also the risk appetite of the investor.
Investors could broadly be classified into three categories
- High-risk
- Moderate-risk
- Low-risk
A suggested holding pattern is presented below. The duration of the holdings is, of course, to be linked to the time line for achievement of financial goals

| Brief description of Fund | Suggested %age holding based on Risk Appetite | ||
| High | Moderate | Low | |
| Equity – Large Cap | 30 | 25 | 20 |
| Equity – Small & Mid Cap | 30 | 15 | - |
| Equity - Flexicap | 20 | 15 | 15 |
| Balanced | 10 | 20 | 20 |
| Debt | 5 | 15 | 30 |
| Gold | 5 | 10 | 15 |
| Total | 100 | 100 | 100 |
Research the Asset Management Company
Your money will be transferred to a third party for investment and return. While it is true that the fund houses have better knowledge of the markets than most individual investors, not all fund houses are equal. Do a thorough due diligence of the fund house. Check the track record, study the portfolios built, the period for which the fund has been in operation, the Assets Under Management, etc. The investment decisions should be process driven and not be dependent upon a star manager who may part ways with the fund house at any time.
Evaluate the Performance
Every investor looks for a return on his investment, and while the future cannot be predicted, the past performance can be a fairly reliable indicator of what lies ahead. The evaluation should not be restricted to a standalone assessment of the return that the particular fund has delivered but should be measured against the returns generated by the benchmark index and those of competitors’ funds in the category. Investors often fall into the trap of selecting a fund on the basis of its return. But, they should also consider the risk–return trade off by taking into account the standard deviation, alpha and Sharpe ratio of the funds. The terms sound exotic and full of complexities but let’s understand what it is that they tell us. Cutting through the complexities that usually accompany these terms, this is what they indicate.
Standard Deviation
A high standard deviation is indicative of volatility in the performance of a fund in relation to what it should have been based on its historical performance. So, if a fund has an average return of 27% and standard deviation of 15%, it means that the return may vary between 12% on the lower side and 42% on the higher side.
Alpha
Alpha is measured in terms of percentage. A positive alpha represents outperformance of the benchmark index and a negative alpha indicates underperformance of the index. A positive alpha of 20% means that the fund has outperformed the benchmark index by 20%
Sharpe Ratio
It is calculated using standard deviation and excess return to determine reward per unit of risk. First, the average monthly return of the 90-day Treasury bill (over a 36-month period) is subtracted from the fund’s average monthly return. The difference in total return represents the fund’s excess return beyond that of the 90-day Treasury bill, a risk-free investment. An arithmetic annualized excess return is then calculated by multiplying this monthly return by 12. To show a relationship between excess return and risk, this number is then divided by the standard deviation of the fund’s annualized excess returns. The higher the Sharpe ratio, the better the fund’s historical risk-adjusted performance.
Recommended Read : How to Find Standard Deviation, Alpha & Sharpe Ratio of Mutual Funds?
Historical Fund Performances
| Fund Name | Return (%) | Standard Deviation
|
Alpha
|
Sharpe Ratio
|
| ICICI Prudential Value Discovery Fund Growth | 15.87 | 26.66 | 7.21 | 0.52 |
| Reliance Regular Savings Fund Equity Growth | 15.65 | 28.95 | 6.70
|
0.52 |
| UTI MNC Fund Growth | 14.41 | 19.72 | 6.80 | 0.58 |
| Birla Sun Life India GenNext Fund Growth | 14.16 | 21.39 | 5.53 | 0.50 |
| Reliance Equity Opportunities Fund Growth | 13.93 | 26.08 | 5.59 | 0.47 |
| Category Performance | 10.63 | 25.35 | 2.49 | 0.36 |
| S&P BSE 500 India | 8.65 |
Analysis
The results that have been tabulated are of ‘Flexicap’ funds and represent the performance over the past 10 years of operation. The returns are significantly above category performance and are regarded as high considering that the NAV would have been affected by the downside in the stock markets over the past 1 year. Consistency over at least a medium period is what matters and the funds that we have chosen are proven performers. Another critical factor is the risk-reward matrix.
Of the funds that we have selected, Birla Sun Life India GenNext Fund and Reliance Equity Opportunities Fund have the two lowest Alphas and Sharpe ratios with relatively high standard deviations.
We could, therefore, conclude that though these funds are outperforming the category, they are not the crème de la crème of the category. All the selected funds have Alphas and Sharpe ratios significantly higher than the category average But, the standard deviations of three funds are also higher than the category average signaling that these funds may be investing in riskier stocks that are more prone to swings in response to stock market impulses.
For a calculated mix of risk and return, multiply the Alpha and the Sharpe Ratio; the highest result would represent a balanced risk-reward matrix. The return, per se, may not be the best but would be less prone to volatility.
Sources of information
You will find most of the information that you require in the fund fact sheets and on the fund web site. You can also access independent sources such as Value Research and Morning Star. Alternatively, you could visit the fund web sites many of which include a SIP calculator that provides data related to historical performance.
Loads and Expenses
From a holistic point of view, the recurring expenses that are charged by the fund house have a serious impact on the overall return from the scheme. A difference of even 0.50% in the expense ratio can have a tremendous impact over a period of time. This is an expense over which you will not have any control after you join the scheme. The other cost is the exit load which is charged for units that are redeemed within less than 1 year from the date of their purchase.
All mutual funds follow the FIFO or first-in-first-out method for deciding the applicability of exit load. In case you opt to redeem units, the units that have been purchased first are assumed to be redeemed first. The larger the Assets Under Management (AUM), the fixed expenses would be spread out, leaving a higher surplus for investment.
Know Your Fund Manager
The importance of choosing a fund that is process driven has been highlighted but an experienced fund manager with a good track record is a definite plus. In particular, assess the past performance of the fund manager during periods when the markets have gone through stress. If performance at such times is better than the benchmark index and peer performance, it would be indicative of a robust process combined with a knowledgeable fund manager.
The Final Countdown
If you had invested Rs.3,000/-per month for 10 years from January 1, 2006 to December 31,, 2015, through SIP in the schemes that we tabulated earlier, this is what your results would have been. The aggregate amount you would have invested would have been Rs.3,60,000/-
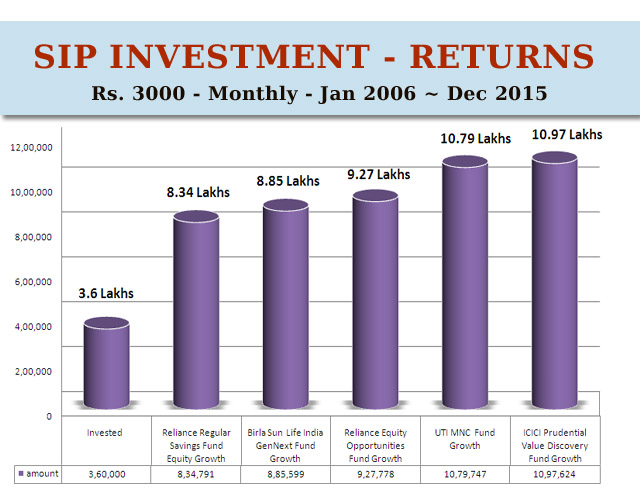
| Name of the Fund | Investment Value |
| ICICI Prudential Value Discovery Fund Growth | 10,97,624.21 |
| Reliance Regular Savings Fund Equity Growth | 8,34,791.24 |
| UTI MNC Fund Growth | 10,79,747.29 |
| Birla Sun Life India GenNext Fund Growth | 8,85,599.42 |
| Reliance Equity Opportunities Fund Growth | 9,27,777.75 |
When it comes to investing in mutual funds through SIP, it’s never too late to make a beginning.
Disclaimer :
This article provides general advice and recommendations and does not constitute personal advice. The selection of funds was made at random. While the calculations are accurate for the period to which they refer, the opinions and examples in this article are for informational and educational purposes only. I have never invested in any of the funds named in this article. The statements in this article should not be construed as advice to invest in the funds named. Mutual fund investments are subject to market risks. Investors are advised to perform personal due diligence before investment. Readers are responsible for the decisions they take.
Bibliography
- ICICI Prudential Mutual Fund.SIP Calculator.Web.14 Mar 2016
- Dipak Mondal. Money Today.Picking the Winner.June 2011. Web.15 Mar 2016
- Rahul Oberoi.Money Today.Zeroing in on the Best.March 2014.Web.15 Mar 2016


?")


Again one more enlightening article !!!! Author has summed up everything that we should know about mutual funds in a single article !!!! bravo to the efforts !!!! Now i will not have to rely on some consultant to help me choose best mutual fund SIP. This article proves that with research and fundamental analysis , we can easily jump into mutual fund avenue…… Thanks & keep posting !!!!